Why Understanding Crypto Market Trends is Crucial
Crypto market trends play a vital role in helping investors make smart decisions. The cryptocurrency market is highly volatile, and understanding key indicators like market cap, BTC rainbow chart, and price trends can help predict future movements and avoid costly mistakes.
This guide will break down essential market analysis tools so you can confidently navigate the crypto landscape.
1. What is Market Cap in Crypto and Why It Matters
Understanding Market Cap
Market capitalization (market cap) is a key metric that helps determine a cryptocurrency’s overall value. It is calculated as:
📌 Market Cap = Current Price × Circulating Supply
For example, if Bitcoin is priced at $40,000 and there are 19 million BTC in circulation, the market cap would be $760 billion.
Why Market Cap is Important
- Measures stability – Higher market cap coins like Bitcoin (BTC) and Ethereum (ETH) tend to be more stable than smaller altcoins.
- Risk assessment – Low market cap cryptocurrencies often have higher risk but greater potential rewards.
- Comparing projects – Investors use market cap to compare different cryptos before investing.
Types of Cryptocurrencies by Market Cap
✅ Large-cap cryptos ($10B+): Bitcoin, Ethereum – Lower risk, long-term stability.
✅ Mid-cap cryptos ($1B–$10B): Solana, Polkadot – Potential for growth, moderate risk.
✅ Small-cap cryptos (<$1B): High-risk, high-reward investments.
🔹 Pro Tip: Always consider market cap, trading volume, and liquidity before investing in a crypto asset.
2. BTC Rainbow Chart: A Simple Way to Analyze Bitcoin’s Price Cycles
What is the BTC Rainbow Chart?
The BTC Rainbow Chart is a long-term Bitcoin price chart that uses color bands to indicate whether BTC is undervalued or overvalued based on historical price movements.
How to Read the BTC Rainbow Chart
🌈 Blue & Green (Undervalued): Historically, a good time to buy Bitcoin.
🟡 Yellow & Orange (Fair Value): Neutral zone, steady growth.
🔴 Red (Overvalued): Potential market bubble, risky to buy at these levels.
Why is the BTC Rainbow Chart Useful?
- Helps investors time their entries and exits.
- Uses historical data to track Bitcoin’s cyclical nature.
- Provides a visual guide rather than complex technical analysis.
🔹 Pro Tip: While the BTC Rainbow Chart is useful, always combine it with other indicators before making investment decisions.
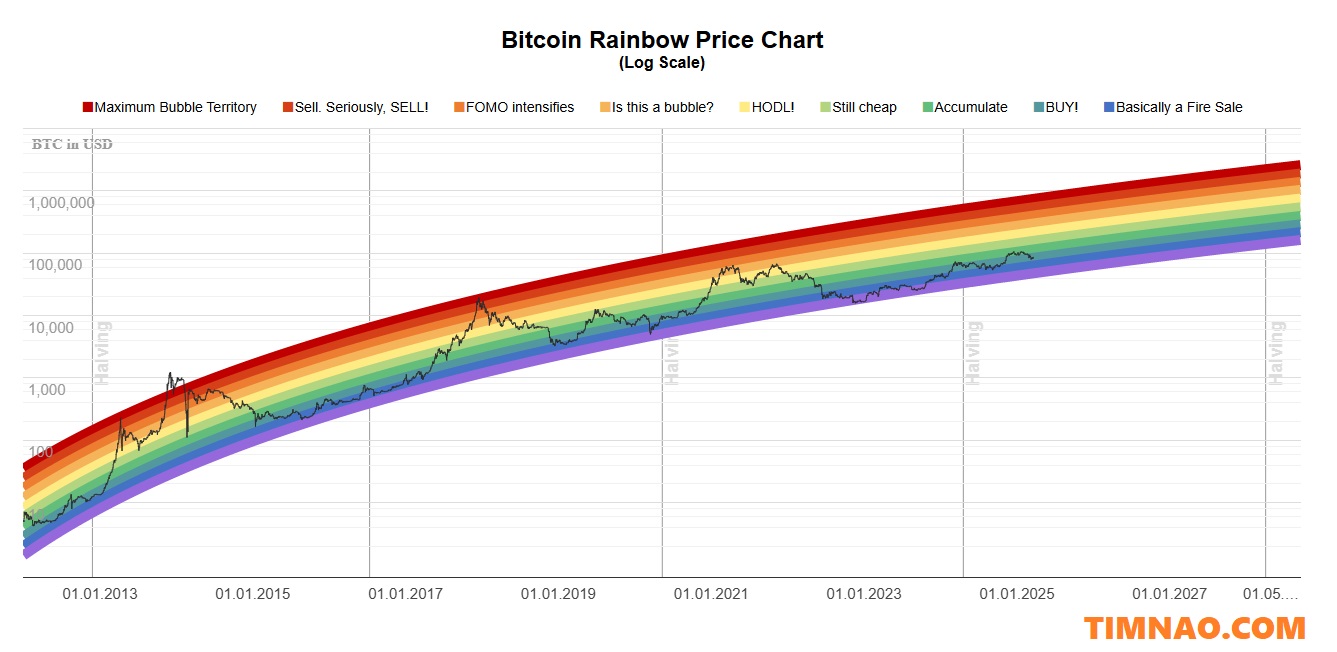
Check here for the latest data of Bitcoin Rainbow Price Chart: https://www.blockchaincenter.net/static/rainbow-chart.html
3. Key Indicators for Analyzing Crypto Market Trends
1. Bitcoin Dominance
Bitcoin dominance measures BTC’s market cap as a percentage of the total crypto market.
- High dominance (50%+): Investors favor Bitcoin over altcoins (safe investment period).
- Low dominance (<50%): Altcoins may be gaining traction (potential for higher profits but increased risk).
2. Fear & Greed Index
The Fear & Greed Index analyzes market sentiment based on factors like volatility, momentum, and social media trends.
- Extreme Fear (0–25): Market panic, potential buying opportunity.
- Neutral (50): Market is balanced.
- Extreme Greed (75–100): Investors are overly bullish, high risk of correction.

Check here for more data of Crypto Fear & Greed Index: https://alternative.me/crypto/fear-and-greed-index/
3. Trading Volume
Trading volume reflects the activity level of a cryptocurrency.
- High trading volume: Strong market interest and liquidity.
- Low trading volume: Weak momentum, potential price manipulation.
4. On-Chain Data
On-chain analysis looks at blockchain data such as:
- Active addresses – More activity = growing adoption.
- Exchange inflows/outflows – Large BTC withdrawals often signal accumulation.
- Whale movements – Tracking large investors can help predict price movements.
🔹 Pro Tip: A combination of technical indicators, sentiment analysis, and on-chain data gives a clearer picture of market trends.
4. How to Identify Bull and Bear Markets
Bull Market Characteristics 📈
✅ Rapid price increases
✅ High trading volume
✅ Strong market sentiment (greed phase)
✅ New all-time highs
Bear Market Characteristics 📉
❌ Falling prices over months
❌ Low trading volume
❌ Negative news sentiment (fear phase)
❌ Market corrections of 20% or more
🔹 Pro Tip: Bull markets are great for maximizing profits, but bear markets are ideal for accumulating assets at a discount.
5. Predicting the Next Crypto Bull Run
Key Factors That Influence a Bull Run
🚀 Bitcoin Halving Events – Historically, BTC halvings lead to bullish price action.
💰 Institutional Adoption – Companies adding Bitcoin to balance sheets create long-term demand.
📊 Regulatory Clarity – Clear regulations can boost investor confidence.
🔗 Blockchain Innovations – Growth in DeFi, NFTs, and Web3 can drive demand.
🔹 Pro Tip: The best investors accumulate during bear markets and sell during bull markets.
Conclusion: Stay Ahead with Crypto Market Analysis
Understanding crypto market trends is essential for making smart investment decisions. By analyzing market cap, BTC rainbow chart, trading volume, and sentiment indicators, you can better predict market movements and maximize your returns.
🚀 Want to stay ahead? Keep tracking market trends, follow reliable sources, and always use multiple indicators before making investment decisions.


