
Strategic Analytics with AI: A Confident, Practical Strategy Upgrade 😄
Strategic analytics with AI is the fastest way to turn “too much data” into clear, confident decisions—without drowning in dashboards or relying on gut feelings alone. If your strategy meetings feel fuzzy, this approach gives you a simple system to spot what matters, test options, and move forward with less stress.
In this guide, you’ll learn how to use AI in strategic planning (the practical way) and apply generative AI for business analytics to summarize messy inputs, pressure-test assumptions, and build strategies your team can actually execute.
Strategy gets messy fast—this is how you make it usable again
Strategy gets messy for a simple reason: real life doesn’t come in neat case-study boxes.
You’re juggling customer feedback, sales numbers, competitor moves, internal politics, budget limits, and a hundred “urgent” requests—often with incomplete information and too little time. If you’ve ever thought, “We have so much data… why are we still confused?”—you’re in the right place.
Here’s the core problem (and it’s incredibly common):
- Too many inputs (reports, tools, opinions, alerts)
- Not enough structure (what decision are we actually making?)
- Too much noise (metrics that look important but don’t change actions)
- Too little follow-through (insights don’t become decisions)
The fix isn’t “more data.” The fix is a decision-first process—one that makes strategy usable.
The “Decision Funnel” that keeps strategy from becoming chaos
Think of strategy like cooking.
Data is your pantry. You can have the best pantry in the world… but if you don’t know what you’re cooking tonight, you’ll just keep opening cabinets.
Use this Decision Funnel to tighten everything up:
- Start with the decision (not the dataset)
Ask: “What choice do we need to make in the next 30–90 days?”
Examples:- “Which customer segment should we prioritize next quarter?”
- “Do we raise prices for new customers?”
- “Do we build feature X or fix onboarding first?”
- Define what “better” means
This prevents the classic trap of optimizing the wrong thing.
Examples:- Growth? Profit? Speed? Risk reduction? Brand trust? Sustainability?
- Choose only the evidence that can change the decision
If a chart is interesting but doesn’t change what you’d do, it’s a distraction. - Turn evidence into 2–4 real options
Strategy isn’t “a report.” Strategy is a choice between options. - Pick one move + set a review trigger
Decisions without review dates quietly become opinions.
This funnel makes your strategy work feel lighter immediately—because it removes the “we should analyze everything” pressure.
A beginner-friendly way to stop drowning in metrics
Most teams don’t have a data problem. They have a metric selection problem.
Here’s a simple filter you can apply to any metric:
- Decision metric: If this changes, we would choose a different option.
- Diagnostic metric: This helps explain why something changed.
- Vanity metric: This looks impressive but doesn’t guide action.
If you’re unsure, use this question:
“If this number moves up or down by 20%, what would we do differently next week?”
If the answer is “nothing,” it’s probably vanity (or at least not strategic right now).
The one-page “Decision Brief” that makes strategy usable across the team
If you want strategy to stop being vague, create a one-page Decision Brief. Keep it short. Keep it readable. Keep it human.
Decision Brief (copy/paste template):
- Decision: (one sentence)
- Why now: (what triggered this?)
- Options: (2–4 realistic paths)
- Constraints: (budget, time, people, brand, legal)
- Assumptions: (what must be true for each option?)
- Signals to watch: (2–3 metrics that would change our minds)
- Next review date: (when we revisit)
You can draft this in Notion or a Google Doc, then link supporting numbers from Google Sheets or Microsoft Excel.
The goal is alignment. When your team shares one page, meetings get calmer—and decisions get faster.
Where AI helps right away (without turning it into “AI theatre”)
AI can be genuinely useful here, but only if you use it for the right jobs.
Use AI to:
- turn messy notes into structured options,
- list assumptions you forgot to say out loud,
- summarize patterns in text (support tickets, reviews, feedback),
- draft a clean decision memo after you’ve chosen.
Avoid using AI to:
- “decide for you,”
- invent numbers you didn’t provide,
- replace stakeholder conversations.
A good “starter prompt” for this stage:
“Help me turn this situation into a one-page decision brief. Here is the context: …
Propose 3 realistic options, list assumptions for each, and suggest 3 signals to monitor.”
Once your strategy is usable, you’re ready for the next layer: building a shared language so analytics and strategy stop feeling like separate worlds.
Strategic analytics with AI: the new common language in strategy
Strategic analytics with AI isn’t a new buzzword for “more dashboards.” It’s a way to connect three things that often live in separate corners:
- Strategy people (direction, positioning, long-term choices)
- Analytics people (data, methods, models, measurement)
- Operators (execution, constraints, reality)
When these groups don’t share a common language, you get predictable pain:
- analysts produce reports nobody uses,
- strategy becomes vague “vision talk,”
- execution teams get whiplash from shifting priorities.
A shared language fixes that—because it turns strategy into something teams can work with, not just talk about.
The “Data → Information → Insight → Action” ladder (and where teams get stuck)
This ladder explains 90% of why strategy feels heavy.
- Data: raw facts (transactions, tickets, web events, comments)
- Information: organized data (tables, charts, dashboards, summaries)
- Insight: meaning (what’s driving results, what it implies)
- Action: decisions (what we will do, when, and how we’ll measure it)
Most teams stop at information. They have charts. They have dashboards. They have weekly metrics reviews.
But they don’t have enough:
- clear options,
- assumptions,
- scenario thinking,
- decision triggers,
- and follow-up loops.
Strategic analytics with AI helps you climb from information to action faster—because AI can speed up the organizing and summarizing work that normally slows teams down.
The “analysis + synthesis” split (why you need both)
Strategy is a blend of:
- Analysis: breaking reality into parts (metrics, drivers, costs, risks)
- Synthesis: assembling meaning (patterns, narratives, emerging signals)
Beginners often think “real strategy” is mostly synthesis—big ideas and bold direction.
In practice, strategy fails when synthesis is untested.
At the same time, strategy also fails when analysis is endless and directionless.
A practical rule:
- Use analysis to reduce uncertainty.
- Use synthesis to create direction.
- Use a decision to stop the loop.
What “generative AI for business analytics” is good for (in plain language)
Generative AI for business analytics doesn’t replace analytics. It helps you do the human-heavy parts faster:
- Summarize and structure messy inputs (meeting notes, interviews, research)
- Extract themes from text (support tickets, customer reviews, sales calls)
- Generate scenario ideas (downside/expected/upside drivers)
- Draft communication (decision memos, strategy briefs, stakeholder updates)
This matters because strategy work isn’t only math. It’s also:
- ambiguous language,
- conflicting priorities,
- incomplete information,
- and the need to explain decisions in a way humans trust.
AI helps you do that “translation” work with less friction.
A simple “Human + AI” workflow you can actually run
Here’s a beginner-friendly system that keeps humans in charge and uses AI for leverage.
- Human defines the decision
One sentence. No exceptions. - AI helps draft options + assumptions
You keep or discard. AI doesn’t decide. - Human picks the minimum dataset needed
You choose what’s relevant. - AI helps summarize qualitative data
Themes, categories, frequent complaints, common questions. - Human chooses the model (lightweight)
Decision tree, weighted scoring, scenario table. - AI drafts the memo
Human edits for reality, tone, and accountability.
If you want, the AI tool for step 2 and 6 can simply be ChatGPT. Keep the final call human.
The “Strategy Conversation Starter” (a quick meeting script)
If you want strategy meetings to feel less random, use this sequence:
- “What decision are we making today?”
- “What are the realistic options?”
- “What assumptions does each option rely on?”
- “What evidence do we trust?”
- “What would change our minds?”
- “What are we doing next, and when do we review it?”
This gives your team a repeatable rhythm—so strategy stops being personality-driven.
Now that we’ve built the shared language, the next step is using the right analytics “gear” at the right time—so you don’t overcomplicate or underthink the decision.
The three analytics gears: descriptive, predictive, prescriptive
A lot of beginners think analytics is one thing. It’s not.
Analytics has different “gears,” and strategy gets easier when you choose the right gear for the question you’re trying to answer.
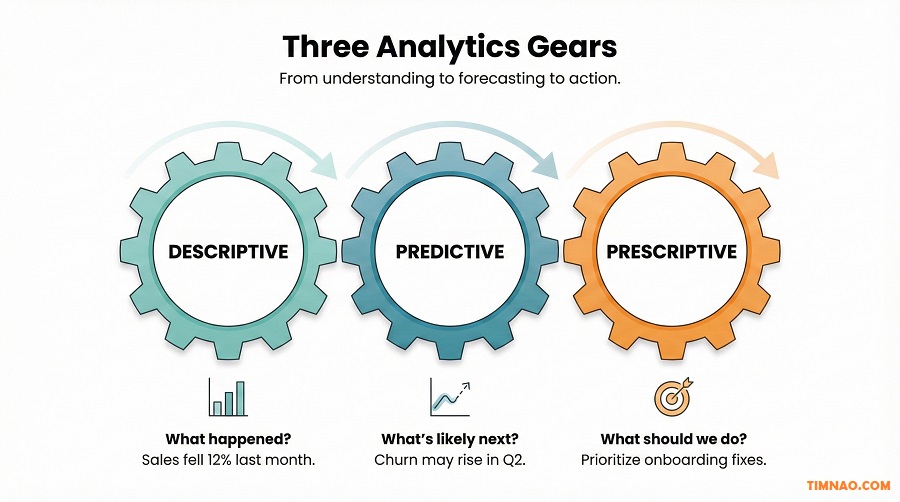
Gear 1: Descriptive analytics (What happened?)
Descriptive analytics is your reality check. It shows what’s been happening in your business or environment.
Typical outputs:
- dashboards
- trends over time
- segmentation summaries
- “before vs after” comparisons
When it’s useful in strategy:
- when the team disagrees about what’s true,
- when performance shifts suddenly,
- when you need a shared baseline before choosing a direction.
Beginner checklist for good descriptive analytics:
- Define key terms (What counts as “active”? What is “churn”?)
- Use consistent time windows (week vs month)
- Segment results (by channel, region, cohort, product line)
- Compare to a baseline (last month, last quarter, same season)
Tools:
Microsoft Excel, Google Sheets, Power BI, Tableau
A simple example:
- “Churn increased” becomes “Churn increased mainly in new customers from Channel B after onboarding changes.”
That’s already more strategic because it points to options.
Gear 2: Predictive analytics (What’s likely next?)
Predictive analytics is about forecasting—using patterns in past data to estimate future outcomes.
Common use cases:
- demand forecasting
- churn risk prediction
- lead scoring
- capacity planning
When it’s useful in strategy:
- when you need to prepare for likely futures,
- when timing matters (cash flow, staffing, inventory),
- when you’re deciding between options with different risk profiles.
A beginner-friendly way to use predictive without overpromising:
- Don’t aim for perfect predictions.
- Aim for directional clarity.
Use a simple “range forecast”:
- downside / expected / upside
Example:
- “If churn stays at this rate, revenue in 90 days is likely between X and Y.”
Even a rough range helps you compare options more honestly.
Gear 3: Prescriptive analytics (What should we do?)
Prescriptive analytics helps you choose among options—especially when you have constraints.
This is where strategy becomes “decision engineering”:
- budget limits
- staffing limits
- operational capacity
- deadlines
- risk tolerance
Prescriptive methods don’t have to be scary. Beginners can start with:
1) Weighted scoring (AHP-lite)
- Define 5–7 criteria
- Assign weights totaling 100
- Score options 1–10
- Multiply and compare
This is powerful because it surfaces hidden disagreements:
- One person values speed.
- Another values risk reduction.
- Another values brand trust.
Now you can talk about it clearly.
2) Decision trees
Great when outcomes are uncertain and sequential:
- “If we launch now, what might happen next?”
- “If we delay, what changes?”
- “If a competitor responds, then what?”
3) Simple optimization thinking
Even without math, you can apply the mindset:
- “Given our constraints, what’s the best use of time and money?”
The “gear selector” cheat sheet (use this in real meetings)
Use this quick guide to choose the right gear:
- If we don’t agree on what’s happening → Descriptive
- If we agree on reality but worry about what’s next → Predictive
- If we have options and constraints and need to choose → Prescriptive
And here’s the hidden bonus:
Most strategic decisions need more than one gear—but in the right order.
Start descriptive → add predictive → finish with prescriptive.
A short example: choosing a growth move without spinning in circles
Let’s say you’re deciding between:
- launching a cheaper plan,
- improving onboarding,
- expanding to a new channel.
A clean flow looks like this:
- Descriptive: Which segments churn most? Which channels convert best?
- Predictive: If onboarding improves activation by 10%, what could churn do?
- Prescriptive: Weighted scoring using criteria (speed, risk, impact, effort).
- Decision + review trigger: “We choose onboarding improvements, review in 45 days.”
This is how strategic analytics with AI stays practical: it keeps you moving toward a choice, not just producing more charts.
And now that you can select the right analytics gear, the next step is building your repeatable decision sprint—so this becomes a habit instead of a one-time “strategy project.”
From digital data streams to decisions: process-to-actuate vs assimilate-to-analyze
“Digital data streams” sounds fancy, but it’s simply this: data that arrives continuously, often from places you don’t fully control.
Think:
- website events (clicks, drop-offs, errors)
- product usage logs
- customer support chats and tickets
- social mentions and reviews
- supply chain updates
- payments, refunds, chargebacks
If you try to treat all of this like a monthly report, you’ll feel permanently behind. The trick is to split your strategy work into two modes—each with a different goal.
Process-to-actuate: when speed matters more than perfection
This mode is about acting quickly on signals, even if you don’t have full certainty yet.
You’re basically saying:
“If X happens, we need to respond within minutes/hours—because waiting costs us.”
Good fits:
- conversion drops suddenly
- churn spike in a specific segment
- payment failures increase
- inventory hits critical levels
- a competitor launches a direct attack (pricing, ads, messaging)
Beginner rule: Start with alerts, not fully automated actions.
A simple process-to-actuate setup (that won’t overwhelm your team):
- Pick 1–3 “red flag” events
- Example: “Checkout error rate > 2% for 30 minutes”
- Example: “Trial activation rate drops below baseline for 24 hours”
- Example: “Support tickets tagged ‘billing’ double week-over-week”
- Define a trigger you can explain in plain English
If you can’t explain it, your team won’t trust it. - Assign an owner + response play
- Who gets notified?
- What do they do first?
- What’s the “stop the bleeding” action?
- Log the incident + the outcome
This is what turns “reacting” into “learning.”
Where AI fits nicely here (without becoming risky):
- Categorize incoming text fast (tickets, chats, reviews)
- Draft a short incident summary for your team
- Suggest likely causes as hypotheses, not “truth”
Tools that work well:
- ChatGPT for quick summaries and hypothesis lists
- Notion for a simple “Signal Log” database
- Microsoft Excel or Google Sheets for thresholds and baselines
Assimilate-to-analyze: when you want durable strategic insight
This mode is slower, but it’s where strategy gets stronger over time.
You’re saying:
“Let’s combine multiple sources so we can understand what’s really driving results, then make better long-term moves.”
Good fits:
- “What’s driving churn across customer types?”
- “Which acquisition channels produce high-LTV customers?”
- “What makes adoption stick after onboarding?”
- “What’s the pattern behind rising costs?”
Assimilate-to-analyze works because strategy problems rarely have one cause. You usually need to merge:
- internal performance data (revenue, usage, churn)
- operational data (delivery time, defects, staffing)
- qualitative data (feedback, complaints, competitor messaging)
A beginner-friendly assimilation workflow:
- Start with the question (one sentence)
- “Why did retention drop in our mid-tier customers?”
- List the 3–5 data sources that could answer it
- product usage logs
- support tickets
- billing events
- onboarding completion
- segment info
- Create one shared “dictionary” of definitions
This sounds boring, but it prevents 80% of confusion.- What counts as “active”?
- When do we label a user “churned”?
- How do we define “activation”?
- Combine just enough to test a few hypotheses
Don’t merge everything “just in case.”
Pick 2–3 hypotheses and collect what you need to test them. - Turn insights into options
Insight is not the finish line. Strategy starts when you have choices:- change onboarding
- adjust pricing
- improve support workflow
- reposition messaging
- drop a segment that doesn’t fit
Where generative AI for business analytics shines in assimilation work:
- turning messy feedback into themes you can quantify
- extracting repeated customer pain points
- drafting a “what we learned” memo that’s readable and actionable
A good prompt for this stage:
“Here are 40 customer comments and 20 support tickets. Group them into themes, estimate frequency, and suggest 3 hypotheses that could explain churn. Keep it practical.”
The “Which mode am I in?” checklist
Use this quick filter before you start analyzing:
- If delay is expensive → process-to-actuate
- If understanding causes long-term value → assimilate-to-analyze
- If you’re unsure → start with an alert + a lightweight assimilation review later
This keeps strategic analytics with AI grounded in reality: fast when needed, deep when it matters.
Modeling without math panic: decision trees, AHP, and causal loops
Models aren’t about being “smart.” They’re about being clear.
When strategy discussions go in circles, it’s usually because:
- assumptions are hidden
- trade-offs aren’t explicit
- people are optimizing different goals
A lightweight model fixes that. Below are three beginner-friendly models you can use immediately—without advanced math.
Decision trees: the cleanest tool for uncertainty
Decision trees are perfect when:
- there’s a clear choice,
- outcomes are uncertain,
- and you want to compare options honestly.
You’re basically mapping:
Decision → possible outcomes → rough likelihood → impact
Here’s how to build one in 15 minutes:
- Write the decision
- “Do we enter Market B this quarter?”
- List 2–3 options
- Enter now
- Pilot first
- Don’t enter yet
- For each option, list 2–4 realistic outcomes
Keep outcomes simple:- High adoption / Medium / Low
- Competitor reacts / doesn’t react
- Regulation delays / smooth launch
- Assign rough probabilities (or ranges)
You can use:- 20/60/20
- or ranges like “10–30%”
- Estimate impact
Use simple numbers:- revenue range
- cost range
- time-to-break-even
- risk severity (low/med/high)
- Compare expected value (optional)
If you’re in Microsoft Excel, you can calculate:- probability × impact
But even without calculating, the tree still reveals weak assumptions.
- probability × impact
Beginner win: Decision trees make uncertainty discussable. Instead of arguing, you ask:
- “Which probability feels wrong?”
- “What evidence could improve this estimate?”
- “What would make the downside survivable?”
AHP (AHP-lite): when teams disagree on what “best” means
AHP sounds academic, but the beginner version is simply:
weighted scoring.
Use it when:
- options are clear,
- but people disagree on priorities (speed vs risk vs brand vs profit).
AHP-lite steps:
- Choose 5–7 criteria
Example criteria for a strategic move:- Expected impact
- Speed to implement
- Risk level
- Cost
- Team effort
- Brand fit
- Customer value
- Assign weights totaling 100
Example:- impact 30
- speed 15
- risk 20
- cost 10
- effort 10
- brand 15
- Score each option 1–10 per criterion
Keep it fast and honest. - Multiply and sum
This gives you a ranking. - Discuss the “why,” not just the score
The real value is the conversation:- “We overweighted speed.”
- “We’re underestimating risk.”
- “This option wins only if we believe X.”
You can do AHP-lite in:
Where AI helps:
- suggest criteria you might have missed
- propose reasonable weights as a starting point (you still decide)
- draft a short explanation of why the top option won
Causal loops: for “everything affects everything” strategy problems
Some strategy problems aren’t linear. They’re feedback systems.
Example loop:
- improve product quality → fewer support tickets → faster response time → higher satisfaction → better retention → more referrals → higher demand → more load → slower response time (oops)
Causal loops are useful when:
- fixes create side effects,
- the same issue keeps coming back,
- your business feels like a “domino machine.”
How to map a causal loop (beginner-friendly):
- Name the outcome you care about
- “Retention” or “Customer satisfaction”
- List 5–8 drivers that influence it
- onboarding completion
- feature adoption
- response time
- bugs
- perceived value
- pricing friction
- Draw arrows and label direction
- “More onboarding completion → higher activation” (positive)
- “More bugs → lower satisfaction” (negative)
- Find one reinforcing loop and one balancing loop
- Reinforcing loop amplifies change (good or bad)
- Balancing loop stabilizes (like capacity limits)
- Pick one leverage point to test
A leverage point is where a small change creates a bigger outcome.
Examples:- shorten onboarding steps
- improve “first success” moment
- reduce response time for one ticket category
- change pricing communication, not pricing itself
Tools to draw loops:
- Miro
- Lucidchart
- Notion (simple diagrams + notes)
Where AI helps:
- turn a messy list of factors into a clean loop draft
- suggest missing drivers (like capacity constraints)
- generate “what could go wrong” side effects to watch
Important: A causal loop is not a prediction machine. It’s a clarity machine.
Which model should you choose?
Here’s the quick selector:
- If uncertainty is the main issue → decision tree
- If priorities are the main conflict → AHP-lite
- If side effects and feedback loops dominate → causal loop
You don’t need all three every time. You need the one that makes the decision easier.
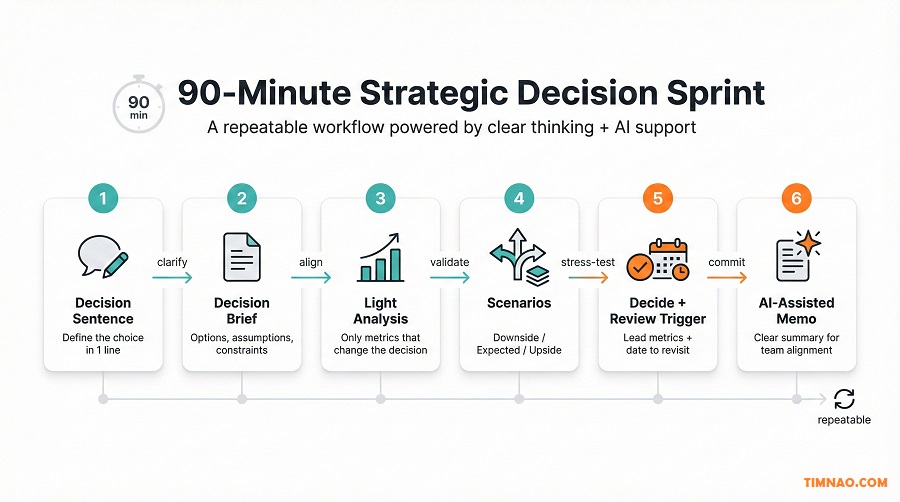
A 90-minute strategic decision sprint (repeatable, AI-friendly)
This is the part most beginners love, because it turns “strategy” into something you can actually do on a Tuesday.
A 90-minute sprint is a structured mini-workshop that outputs:
- a clear decision,
- 2–4 options,
- key assumptions,
- one chosen move,
- and a review trigger.
No fluff. No “let’s circle back.”
Pre-sprint setup (10 minutes, optional but helpful)
If you can, do this before the meeting:
- Bring a one-page “current reality snapshot”:
- 3–5 key metrics
- one chart max per metric (no dashboard parade)
- Collect a small sample of qualitative input:
- 10–20 customer comments or tickets
- 5 competitor notes or screenshots (no external links needed)
- Draft a rough decision statement (even if imperfect)
If you’re using AI, you can ask ChatGPT to turn your messy notes into a draft decision brief. You’ll edit it live.
Sprint agenda (90 minutes)
Here’s a clean, repeatable flow. Use it exactly as written until your team builds the habit.
Minute 0–10: Lock the decision
- Everyone agrees on one sentence:
- “Today we decide: ________.”
- If you can’t lock it, your sprint will fail.
- Make it smaller if needed.
Minute 10–25: List options (2–4 only)
Rules:
- Options must be real (something you could actually do).
- Avoid “do everything” options.
Good option formats:
- “Focus on Segment A”
- “Fix onboarding first”
- “Raise prices for new customers only”
- “Pilot before full rollout”
AI-friendly move:
- Ask AI for missing options, then choose what’s realistic.
Prompt:
“Given this decision and context, suggest 4 strategic options. Keep them practical and mutually distinct.”
Minute 25–45: Surface assumptions + constraints
This is where strategy becomes honest.
For each option, ask:
- What must be true for this to work?
- What could break it?
- What constraints limit us?
Create a simple table:
- Option
- 3 assumptions
- 2 constraints
- 2 signals to monitor
AI-friendly move:
- Use AI to generate assumptions quickly, then refine as a team.
Minute 45–60: Choose your model (one only)
Pick the model that fits the problem:
- Decision tree if uncertainty dominates
- AHP-lite if priorities conflict
- Causal loop if side effects are the risk
Time-box it. You’re aiming for clarity, not perfection.
Minute 60–75: Decide and define success
Lock:
- which option you choose
- what “success” looks like
- what you will measure
Define:
- 1–2 lead metrics (early indicators)
- 1 lag metric (outcome)
- review date (30–60 days)
Example:
- Lead: activation in first 7 days
- Lag: churn after 60 days
- Review: 45 days from now
Minute 75–90: Draft the decision memo (in plain language)
This is where many teams skip—and then wonder why alignment collapses.
Your memo should include:
- Decision
- Why now
- Option chosen (and why)
- What you’re not doing (for now)
- Metrics + review date
- First next steps (owner + deadline)
AI-friendly move:
- Have AI draft the memo, then you edit for tone and truth.
Prompt:
“Draft a one-page decision memo for the team. Use a clear, friendly tone. Include decision, rationale, assumptions, metrics, and review date.”
After the sprint: the 3 follow-through moves
To make this sprint actually matter, do these three things:
- Create a single owner
One person owns follow-through, even if many people execute. - Schedule the review immediately
Put it on the calendar while motivation is high. - Log what you learned
One paragraph is enough:- what we expected
- what happened
- what we’d do differently
That’s how strategic analytics with AI becomes a capability—not a one-time workshop.
A natural next step
Once your team can run a sprint like this, you’ll start noticing a new challenge: mistakes that don’t come from “bad data,” but from human habits—like chasing vanity metrics, skipping review triggers, or trusting AI too quickly. Next, we’ll tighten those weak points so your system stays reliable under pressure.
Where teams slip up (and how to fix it fast)
Even with a solid workflow, teams still slip. Not because they’re “bad at strategy,” but because strategy sits right at the intersection of uncertainty + pressure + human bias.
The good news: most failures come from a small set of predictable mistakes. If you can spot them early, you can fix them fast—without rebuilding your whole process.
Slip #1: Starting with data instead of the decision
This is the most common one.
A team opens a dashboard, sees 40 charts, and starts reacting emotionally:
- “Why is this down?”
- “We should investigate that!”
- “Let’s build a report for this!”
Two hours later, there’s no decision—just more “analysis to-do items.”
Fast fix: Use a “decision lock” question at the top of every meeting:
- “What are we deciding today?”
- “What choice will we make by the end of this session?”
If you can’t answer in one sentence, pause and rewrite the decision. Strategy work should feel like narrowing, not expanding.
Slip #2: Mixing up leading vs lagging metrics
Lagging metrics tell you what already happened:
- revenue
- profit
- churn
- market share
Leading metrics give early signals:
- activation rate
- onboarding completion
- time-to-first-value
- product usage frequency
- customer satisfaction
Teams slip when they only watch lagging metrics and then panic late.
Fast fix: For every strategic move, define:
- 1–2 lead metrics (early indicators)
- 1 lag metric (final outcome)
- a review date
Example: If you change pricing,
- lead: trial-to-paid conversion
- lead: cancellation rate in first 14 days
- lag: revenue per user after 60 days
Now you’ll detect problems early instead of waiting for the quarterly report to scream at you.
Slip #3: Treating correlation like causation (aka “the chart made me do it”)
This shows up like:
- “People who use Feature X churn less, so Feature X causes retention.”
Maybe. Or maybe:
- better-fit customers naturally use Feature X more
- power users adopt more features and also churn less
- Feature X is just a “signal,” not the cause
Fast fix: Use a quick “three alternatives” rule:
Before you claim causation, list three other explanations.
Then choose one low-cost test:
- a small A/B test
- a pilot cohort
- a controlled rollout
- comparing similar segments instead of the whole base
You don’t need perfect science. You need enough rigor to avoid confident wrong conclusions.
Slip #4: Overbuilding models as procrastination
This one is sneaky because it looks productive.
You get:
- giant spreadsheets
- fancy scoring rubrics
- “just one more week of analysis”
But the real issue is fear: fear of being wrong, fear of choosing, fear of accountability.
Fast fix: Put a hard time box on analysis:
- “We have 60 minutes to analyze, then we pick.”
If the team can’t decide, it’s usually because:
- the decision statement is unclear, or
- the options aren’t realistic, or
- the success criteria are not agreed.
Fix those, not the spreadsheet.
Slip #5: Using AI as a “truth machine”
This is becoming more common as teams adopt generative AI.
AI drafts a confident plan, and people start treating it like a senior consultant:
- “It says we should focus on Segment B.”
- “It says our pricing is too low.”
But AI can be wrong, outdated, or simply guessing—especially if your prompt is vague.
Fast fix: Use AI in strategic planning with guardrails:
- AI can propose options, assumptions, risks, frameworks
- Humans confirm data, constraints, execution reality
- If AI gives numbers you didn’t provide, treat them as placeholders
A safe AI habit:
- Ask AI to give questions and checklists, not “the answer.”
Example prompt:
“List the questions we must answer before choosing a pricing strategy. Then propose 3 options with assumptions and risks.”
Slip #6: Forgetting the human side (buy-in, trust, and clarity)
A strategy can be “correct” and still fail if the team doesn’t trust it or understand it.
Signs:
- people nod in the meeting but do nothing afterward
- teams interpret the strategy differently
- execution drifts back to old habits
Fast fix: Build a habit of writing the “decision memo” in plain language:
- what we decided
- why we chose it
- what we’re not doing
- what success looks like
- when we review
Then share it in one place (Notion, email, team chat). If strategy isn’t communicated clearly, it doesn’t exist.
Slip #7: No review trigger (strategy becomes “set and forget”)
Without review triggers, teams either:
- never change course (even when evidence says they should), or
- change course constantly (because nobody knows what “normal variation” looks like)
Fast fix: Every strategic move must include:
- the earliest signal that it’s working (lead metric)
- the earliest signal that it’s failing (lead metric)
- a review date
This turns strategy into learning—not guessing.
Now let’s make this real with two mini walkthroughs you can copy.
Mini walkthrough: choosing a pricing strategy in a noisy market
Pricing is a perfect strategy problem because it’s emotional. People worry about:
- “What if customers leave?”
- “What if we look cheap?”
- “What if we price too high and kill growth?”
And the market is noisy:
- competitors change plans
- customers complain loudly
- conversion fluctuates
- internal teams disagree
Here’s how to approach pricing using strategic analytics with AI without melting your brain.
Step 1: Lock the decision (one sentence)
Bad decision statements:
- “We need to fix pricing.”
- “Our pricing feels off.”
Good decision statement:
- “Should we raise prices for new customers next quarter, and if yes, by how much?”
Or:
- “Which pricing move should we prioritize in the next 60 days: raise price, add a lower tier, or improve packaging?”
Pricing decisions must be specific. Otherwise you’ll just argue.
Step 2: Write 3 realistic options (not 10)
Keep it simple. Here are three options that cover most cases:
- Raise prices for new customers only
- Introduce a lower-priced tier to reduce entry friction
- Keep price but improve packaging/onboarding to increase perceived value
Notice what’s missing:
- “Change everything at once”
- “Run 12 experiments simultaneously”
Pricing needs focus.
Step 3: Pull the “minimum useful dataset”
You do not need a 40-metric dashboard to make a pricing decision.
Start with:
- conversion rate (by channel and segment)
- churn / retention (by cohort and segment)
- ARPU / revenue per user (or average order value)
- discount usage (if relevant)
- support tickets tagged pricing/billing (qualitative signal)
If you can segment by:
- new vs existing customers
- acquisition channel
- plan type
do it. Pricing impact is rarely uniform.
Step 4: Use AI to summarize qualitative noise into usable themes
Pricing feedback is messy:
- “Too expensive”
- “Not worth it”
- “Confusing”
- “I don’t get what I’m paying for”
This is where generative AI for business analytics helps.
You paste a small sample (20–50 items) into ChatGPT and ask:
“Group these customer comments into themes. Identify which themes are about price level vs value perception vs confusion. Suggest what data we should check next.”
What you want out of AI:
- themes you can name
- repeated confusion points
- assumptions to test
Not “the perfect answer.”
Step 5: Build a 3-scenario view (downside / expected / upside)
Pricing uncertainty is unavoidable, so stop trying to eliminate it. Manage it.
For each option, write:
- Downside scenario: what could go wrong?
- Expected scenario: what’s the realistic outcome?
- Upside scenario: what would make it surprisingly successful?
Example for “raise prices for new customers only”:
- Downside: conversion drops hard in one channel
- Expected: conversion slightly down, revenue per user up
- Upside: better-fit customers self-select, churn improves
Step 6: Choose a simple prescriptive method
For pricing, two easy methods work well:
A) AHP-lite weighted scoring (fast and collaborative)
Criteria example:
- revenue impact (30)
- growth impact (20)
- churn risk (20)
- complexity to implement (15)
- brand fit (15)
Score each option 1–10. Multiply by weights. Discuss.
The score isn’t “truth.” It’s a structured conversation.
B) Decision tree (if uncertainty dominates)
If the team is stuck on “what if conversion drops,” do a decision tree:
- if conversion drop is small → outcome A
- if conversion drop is big → outcome B
This makes risk visible and easier to plan for.
Step 7: Decide + define triggers (so you don’t panic later)
A pricing move without triggers leads to chaos.
Define:
- lead metric: trial-to-paid conversion (weekly)
- lead metric: early cancellation rate (first 14 days)
- lag metric: revenue per user after 60 days
- review date: 45 days after rollout
Now you can move confidently because you know what you’re watching.
Step 8: Publish a one-page pricing decision memo
This is where pricing wins or loses internally.
Your memo should include:
- what we changed
- who it applies to (new vs existing)
- why we chose it
- what we expect to happen
- what would cause us to revert
AI can draft it, humans must approve it.
And that’s pricing: not perfect, but controlled, measurable, and calm.
Mini walkthrough: market entry with a decision tree (no drama required)
Market entry is another classic strategy problem—high stakes, high uncertainty, and lots of opinions.
Typical arguments:
- “We’ll dominate there!”
- “It’s too risky!”
- “Our competitors will crush us!”
- “We need to move now!”
A decision tree is the antidote because it forces the team to talk about:
- what could happen,
- how likely it is,
- and what you’ll do if things go wrong.
Step 1: Define the decision clearly
Example:
- “Should we enter Market B in Q2, or run a pilot first?”
Clear. Specific. Time-bound.
Step 2: Choose 2–3 entry options
Keep it realistic:
- Full entry now
- Pilot (limited launch)
- Delay entry (focus on strengthening home market first)
Step 3: Identify key uncertainties (3–5 max)
Don’t list 20 uncertainties. Pick the ones that actually change outcomes.
Examples:
- demand level (high/medium/low)
- customer acquisition cost (manageable/high)
- competitor response (aggressive/mild)
- regulatory barrier (none/moderate/high)
- distribution partner success (yes/no)
Step 4: Build the decision tree with simple outcomes
You’re mapping “paths” like:
- If we enter now →
- if demand is high and CAC is manageable → strong growth
- if demand is medium and competitor reacts → slow growth
- if demand is low → losses and distraction
- If we pilot →
- we learn faster with lower downside
- but we may lose speed advantage
- If we delay →
- we reduce risk
- but we may miss a window
Step 5: Add rough probabilities (ranges are fine)
Beginners get stuck here because they think probabilities must be precise.
They don’t.
Use simple ranges:
- high demand: 20–40%
- medium demand: 40–60%
- low demand: 20–30%
Or do a qualitative probability:
- likely / possible / unlikely
The tree still works.
Step 6: Assign impact ranges (not one number)
Instead of “profit = $2M,” use ranges:
- revenue: $X–$Y
- cost: $A–$B
- time-to-break-even: 6–18 months
- strategic distraction risk: low/med/high
Now the team can compare options without pretending the future is known.
Step 7: Decide with a “risk-managed” mindset
Decision trees often reveal that the best move is not “enter or don’t enter.”
It’s:
- “pilot with strict criteria”
- “enter now but with a stop-loss trigger”
- “delay until one signal is confirmed”
Example decision:
- “We pilot in Market B for 8 weeks. If CAC is below X and retention is above Y, we scale. If not, we stop.”
That’s calm strategy.
Step 8: Use AI to improve the tree (without letting AI run it)
AI can help you spot missing branches:
- “What if a competitor copies our offer?”
- “What if a distribution partner fails?”
- “What if currency or regulation shifts?”
A safe prompt:
“Here is our market entry decision tree outline. Suggest missing uncertainties and possible outcomes. Keep it realistic and business-focused.”
Then humans decide what to include.
Step 9: Write the pilot criteria and review date
This is where market entry becomes actionable.
Define:
- pilot duration
- success criteria (lead + lag)
- budget cap
- owner
- review date
Now the decision is not “a dream.” It’s a controlled experiment.
A simple scorecard that keeps strategy honest
A strategy without a scorecard is like a diet without a scale: you might feel like you’re doing the right things… but you can’t tell if it’s working until it’s too late.
The goal of this scorecard isn’t to “measure everything.” It’s to keep your strategic analytics with AI workflow grounded in reality, so your decisions stay accountable, calm, and adjustable.
The 5-number scorecard (copy/paste and start today)
For most beginners, 5 numbers is the sweet spot: enough to guide action, not enough to overwhelm.
Use this structure:
- Outcome Metric #1 (Lag) – the big result you ultimately want
- Outcome Metric #2 (Lag) – a second “anchor” so you don’t optimize one number blindly
- Signal Metric #1 (Lead) – the earliest sign your strategy is working
- Signal Metric #2 (Lead) – another early sign (usually quality or friction)
- Capability Metric (Process) – are we getting better at decisions, not just outcomes?
Example scorecard (SaaS / online service):
- Lag #1: Monthly recurring revenue (MRR)
- Lag #2: 60-day retention
- Lead #1: Activation rate in first 7 days
- Lead #2: Time-to-first-value (median)
- Capability: % of strategic decisions with a decision brief + review date
Example scorecard (ecommerce / retail):
- Lag #1: Gross profit
- Lag #2: Repeat purchase rate (60–90 days)
- Lead #1: Checkout conversion
- Lead #2: Return/refund rate
- Capability: “Cycle time” from insight → decision → action (days)
Example scorecard (service business / agency):
- Lag #1: Monthly profit
- Lag #2: Client retention rate
- Lead #1: Lead-to-client conversion
- Lead #2: Average project cycle time
- Capability: # of monthly “decision sprints” completed
You can track this in Google Sheets or Microsoft Excel. Keep it on one page. No extra tabs “just in case.”
How to set baselines and thresholds (so you don’t overreact)
A scorecard is only useful if it tells you when to pay attention.
Start simple:
- Baseline: what’s “normal” right now?
Use the last 4–8 weeks (or last 2–3 months) as a quick baseline. - Threshold: what change is big enough to matter?
Use one of these beginner-friendly threshold rules:- Rule A (percentage): flag when metric moves ±10–15% from baseline
- Rule B (trend): flag when it moves the same direction 3 checks in a row
- Rule C (absolute): flag when it crosses a hard line (e.g., refund rate > 6%)
- Action trigger: what do we do when it’s flagged?
Keep actions lightweight:- investigate root cause
- run a small test
- pause a rollout
- shift a priority for 1–2 weeks
Important: Don’t set 20 thresholds. Set 2–3. Your brain will thank you.
The weekly “15-minute honesty check” (no drama, no dashboards)
This is the ritual that keeps strategy real. Do it once a week.
Agenda (15 minutes):
- Look at the 5 numbers (no scrolling, no extra charts)
- Ask: “What changed meaningfully?”
- Ask: “Do we know why?”
- Choose one of three actions:
- Do nothing (variation is normal)
- Investigate (we need one more data point)
- Act (we already know what to change)
One rule that prevents chaos:
If you can’t name a decision you might change because of a metric, don’t track it.
Where AI helps with the scorecard (without messing up the measurement)
AI in strategic planning is great at making the scorecard easier to use—especially when your inputs include messy text (tickets, reviews, sales notes).
Here are safe, high-value uses:
- Summarize weekly context:
“Here are this week’s numbers and notes. Draft a 6-sentence summary of what changed and possible reasons (as hypotheses).” - Convert feedback into trackable themes (lightweight):
“Group these 30 customer comments into themes and estimate which themes increased this week.” - Draft a decision brief from a flagged metric:
“Activation dropped 12%. Draft a one-page decision brief with 3 options and assumptions.”
Use ChatGPT to speed up the writing and structuring, but keep humans responsible for the actual measurement definitions and final decisions.
A quick “scorecard setup” checklist
If you want to set this up today, use this:
- Pick your 2 lag metrics (outcomes)
- Pick your 2 lead metrics (signals)
- Pick your 1 capability metric (process)
- Define each metric in one sentence
- Set a baseline window (4–8 weeks)
- Set 2–3 thresholds
- Schedule the weekly 15-minute check
Once the scorecard is running, it becomes much easier to build momentum—because you’re no longer guessing. Next, let’s turn this into a plan you can start immediately, even if you’re busy.
Your start-this-week plan (two schedules, same results)
You don’t need a full “strategy overhaul” to benefit from strategic analytics with AI. You need a small, repeatable habit that produces real decisions.
Below are two schedules that both work. Choose based on your life, not your ambition.
Schedule A: 1 hour/day for 7 days (fast momentum)
This is perfect if you want a clear win in one week.
Day 1 — Lock one decision + draft the brief
- Write your decision in one sentence.
- Draft a one-page decision brief (options, assumptions, constraints).
- If you want help drafting: use ChatGPT to propose options, then you edit.
Day 2 — Pull the minimum dataset
- Choose 3–5 metrics that can actually change the decision.
- Define terms (what counts as churn, activation, conversion, etc.).
- Put numbers in one table in Google Sheets or Microsoft Excel.
Day 3 — Descriptive scan (keep it light)
- Trend over time (one line chart per key metric is enough).
- Segment once (by channel, cohort, region, or plan—choose one).
- Write 3 bullets: “What changed?” “Where changed?” “What might explain it?”
Day 4 — Add scenarios (downside / expected / upside)
For each option in your brief:
- Downside: what breaks it?
- Expected: what’s realistic?
- Upside: what would make it surprisingly strong?
Don’t overthink probabilities. Just make assumptions visible.
Day 5 — Choose a model and decide
Pick one:
- Decision tree (uncertainty-heavy)
- Weighted scoring (trade-off-heavy)
Make the decision. Don’t aim for perfect. Aim for clear + measurable.
Day 6 — Build the 5-number scorecard
- Choose 2 lag metrics, 2 lead metrics, 1 capability metric.
- Set baseline window + thresholds.
- Schedule the weekly 15-minute check.
Day 7 — Draft the decision memo + implement the first move
- Write a one-page memo:
- decision, why now, what we chose, what we’re not doing, metrics, review date, owner
- Implement the smallest first action (pilot, test, rollout step).
- Put the review meeting on the calendar.
By the end of Day 7, you’ve turned strategy into a measurable experiment. That’s a big deal.
Schedule B: 2–3 hours/week for 4 weeks (steady and sustainable)
This is ideal if your time is limited or you need buy-in gradually.
Week 1 — Pick the decision + build the brief
- Decision sentence
- 2–4 options
- constraints + assumptions
- agree on “what good means”
Week 2 — Gather evidence + do a descriptive scan
- minimum dataset
- one segmentation pass
- 3–5 bullet insights your team agrees on
Week 3 — Model + decide
- decision tree or weighted scoring
- pick an option
- define lead/lag metrics + review date
- draft the memo
Week 4 — Implement + build your review habit
- take the first action
- set up the 5-number scorecard
- run your first weekly “honesty check”
- log what you learned
This pace is slower, but it tends to stick long-term.
If you’re totally new vs already “data-heavy”
Choose your starting point based on reality:
If you’re brand new to analytics
- Track fewer metrics (3–5 max).
- Focus on clarity:
- one decision
- one brief
- one review date
- Keep the first model simple (weighted scoring is very beginner-friendly).
If you’re already drowning in dashboards
- Don’t build more dashboards.
- Reduce:
- pick one decision
- pick only the metrics that change that decision
- Use AI to summarize and categorize messy qualitative inputs (tickets, calls, reviews) so you can actually use them.
Either way, the win is the same: decisions get clearer and faster.
“Ready-to-use” prompts for this week
If you want to use generative AI for business analytics in a safe, practical way, these prompts work well:
- Decision brief draft
- “Turn this situation into a one-page decision brief: [context]. Propose 3 options, assumptions, constraints, and what signals we should monitor.”
- Assumption stress test
- “Here’s the option we’re leaning toward: [text]. List the top 7 assumptions and how to test each cheaply.”
- Theme extraction from customer feedback
- “Here are 30 customer comments: [paste]. Group into themes, estimate frequency, and suggest what to measure next week.”
- Decision memo draft
- “Draft a one-page decision memo in a clear, friendly tone. Include decision, rationale, metrics, review date, and first next steps.”
Use ChatGPT for speed, then edit like a real human—because your constraints and context are the truth.
What to do after week one (so this becomes a skill)
After your first cycle, your next goal is not “bigger strategy.” Your goal is better loops.
Do this:
- Repeat the decision sprint monthly (even if smaller)
- Keep the same scorecard structure
- Improve one thing each cycle:
- better definitions
- cleaner segmentation
- sharper options
- clearer review triggers
That’s how strategic analytics with AI becomes a real capability—not a one-off project.
Your strategy cheat sheet
- Strategic analytics with AI works best when you start with one decision, not a mountain of data.
- A 5-number scorecard (2 lag, 2 lead, 1 capability metric) keeps strategy honest without overwhelming you.
- Use thresholds + review dates so you don’t panic-react to normal variation—or ignore real signals.
- AI in strategic planning is most useful for structuring options, surfacing assumptions, summarizing qualitative inputs, and drafting memos—not as a “truth machine.”
- Your fastest win is a small, repeatable loop: decide → act → measure → review → learn.
- Choose the schedule that fits your life: 1 hour/day for 7 days or 2–3 hours/week for 4 weeks—both create the same habit.
Disclaimer:
This content is educational and based on general strategic analytics practices. It is not business, financial, legal, or investment advice. Examples are simplified for learning. If you use AI tools, remember they can be wrong or outdated—treat outputs as suggestions, verify with trusted sources and your real data, and make final decisions with human judgment and appropriate professional guidance.
If this guide helped you make strategy feel clearer (and a little less stressful) ☕✨, you can support the blog by buying me a coffee. Every cup helps me keep creating beginner-friendly, practical content like this—thank you so much! 🙏💛
👉 Buy me a coffee here: https://timnao.link/coffee


