Unlock Massive Gains with Smart Trading Volume Tactics 🔥
Trading volume analysis is one of the most underrated yet powerful tools in a trader’s toolkit. While many beginners chase price charts and flashy patterns, seasoned pros know that volume tells the truth. It reveals the real intentions of the market—whether a breakout is genuine, a reversal is forming, or if institutions are secretly making moves. In today’s fast-paced, data-driven markets, understanding trading volume isn’t just an advantage—it’s a necessity.
Whether you’re new to trading or looking to sharpen your strategy, this guide will walk you through the psychology, indicators, and real-world applications of volume-based trading. From mastering emotional signals to building a rock-solid trading system, you’ll discover how to read the market’s pulse and act with confidence.
Ready to unlock the secrets behind price action and make smarter, data-backed decisions? Let’s dive into the ultimate beginner’s guide to trading volume. 📊
📚 Table of Contents
- 🔍 What Is Trading Volume and Why It Matters
- 📊 The Power of Volume in Price Movements
- 🧠 Reading Emotions in the Market with Volume
- 🔧 Top Volume Indicators Every Trader Should Use
- 🚀 Building a Reliable Volume-Based Trading Strategy
- 🔒 Risk Management with Volume Data
- 🌐 How Volume Differs Across Markets
- ✅ Real-World Examples and Practical Lessons
- 📈 The Future of Volume Trading in 2025
- 🧭 Final Thoughts and Beginner Tips
🔍 What Is Trading Volume and Why It Matters
Trading volume analysis is often called the “invisible edge” of successful traders. While most beginners obsess over price charts, true pros know that volume reveals the real story behind price moves.
So, what exactly is trading volume?
In its simplest form, trading volume refers to the number of shares, contracts, or units of a financial asset traded during a given period. Think of it as the pulse of the market. If price is the face of the market, volume is the heartbeat—it shows how alive and engaged traders really are.
But volume isn’t just a technical statistic; it’s a direct reflection of trader interest, conviction, and emotion. High volume means more participants are engaged, often indicating a genuine belief in the current trend. Low volume? That’s a warning sign—it could mean apathy, hesitation, or even false signals.
Why Beginners Often Miss This
Many new traders fall into the trap of trading based solely on price patterns. A breakout may look strong, but if it isn’t backed by rising volume, it could be a false move—a “head fake” that reverses quickly.
Imagine two identical price charts. One shows a stock moving up with heavy volume surges. The other shows the same price movement but with volume fading. Which one is more trustworthy? The answer is always the one with stronger volume.
Quick Analogy:
Think of volume like a crowd’s energy at a concert. A band playing to a roaring audience clearly has momentum and support. But if they’re performing to an empty room? That’s not a good sign—no matter how loud the music gets.
📊 The Power of Volume in Price Movements
Price tells you what’s happening, but volume tells you why.
Here’s how volume interacts with price in different scenarios:
- 📈 Rising Price + Rising Volume: Strong confirmation of an uptrend. More buyers are jumping in—momentum is increasing.
- 📉 Falling Price + Rising Volume: Strong confirmation of a downtrend. Panic selling or heavy institutional exits are likely.
- ⚠️ Price Movement + Low Volume: Unreliable. The move may not be backed by conviction and can easily reverse.
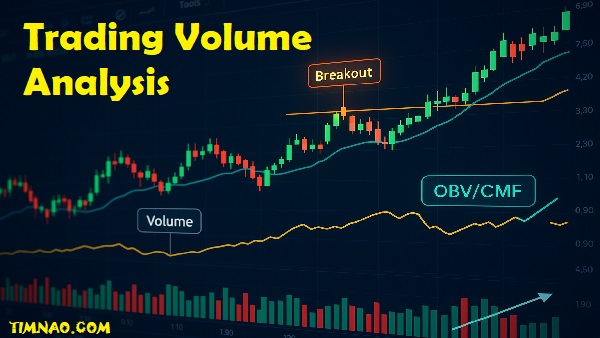
- 🔄 Flat Price + Increasing Volume: Often a precursor to a breakout. Volume builds up before price explodes in one direction.
Spotting Breakouts Early
Let’s say a stock is trading in a narrow range for weeks—boring, right? Suddenly, volume spikes even before price breaks out. That’s a clue that smart money is quietly building positions.
In 2024, many traders used tools like TradingView or Thinkorswim to spot these early volume surges—turning small investments into triple-digit gains. That’s the power of volume.
Red Flag: False Breakouts
One of the most painful experiences for beginners is entering a trade after a “breakout” only to see it reverse and hit your stop loss. What went wrong?
In most cases, volume didn’t support the breakout. Without that validation, you’re essentially guessing. Volume is your lie detector—it exposes weak price moves that look convincing but lack real participation.
🧠 Reading Emotions in the Market with Volume
Every candlestick on a chart tells a story—but it’s the volume that reveals the crowd’s emotion behind that story.
Whether it’s excitement, fear, or indecision, volume exposes the psychological pressure driving market participants. This makes it an invaluable tool for understanding why price is moving and what might happen next.
Volume as Market Sentiment in Action
Volume reflects mass psychology:
- 😃 High Volume in a Rally = Confidence, optimism, FOMO (fear of missing out)
- 😱 High Volume in a Sell-Off = Panic, fear, institutional exit
- 😐 Low Volume During Consolidation = Indecision, waiting for a catalyst
When volume surges dramatically, it usually means the market is reacting emotionally to news, earnings, economic reports, or breaking events. Inexperienced traders may get caught in the noise. But if you know how to read the volume behind the move, you can anticipate reversals, breakouts, or fakeouts more accurately.
Crowd Behavior and Volume Spikes
Ever heard of a volume climax? It’s when the majority of participants have already acted on their emotions—buying the top or selling the bottom. These extremes often signal turning points.
Example: During the 2021 crypto bull run, Bitcoin often saw massive volume spikes just before a temporary top. That was the market yelling, “everyone’s already in!” and usually, a correction followed soon after.
Spotting Institutional vs Retail Volume
Recognizing who is behind the volume can provide a significant edge:
- 🏦 Institutional traders tend to buy or sell in blocks. Their activity causes consistent, heavy volume over time.
- 👤 Retail traders show up with bursts of sudden volume—usually emotionally driven and often at the wrong time.
If you notice a sustained volume buildup without flashy price moves, it might be institutions quietly accumulating. Conversely, sudden spikes on news may indicate retail-driven hype—often short-lived.
💡 Pro Tip: Use platforms like Bookmap or the Time & Sales window in Thinkorswim to analyze order flow and identify large block trades (institutional footprints).
Emotional Traps to Avoid
Here are a few volume-driven psychological traps many beginners fall into:
- FOMO Trading: Seeing high volume and jumping in without analysis—only to buy the top.
- Confirmation Bias: Using rising volume to justify a trade idea instead of reassessing its validity.
- Volume Anxiety: Low-volume periods can create impatience, leading to overtrading or forced setups.
To overcome these traps, develop a rule-based system that waits for confirmation through both price action and volume, instead of relying on emotion.
🔧 Top Volume Indicators Every Trader Should Use
Volume on its own can be powerful—but when combined with the right technical indicators, it becomes a precision tool for smarter trading decisions.
Below are the top volume indicators that are especially helpful for beginners looking to deepen their edge in any market.
📈 1. On-Balance Volume (OBV)
OBV adds volume on up days and subtracts volume on down days, creating a running line that helps confirm trends.
- 📊 If OBV rises while price rises — trend strength confirmed.
- 🚨 If OBV is flat or falling while price rises — potential weakness or false breakout.
✅ Use Case: Confirm if a breakout has real buyer conviction.
💰 2. Accumulation/Distribution Line (A/D Line)
This indicator measures both price and volume to show how much money is flowing in or out of a security.
- 📈 Rising A/D Line = Buying pressure
- 📉 Falling A/D Line = Selling pressure
✅ Use Case: Spot divergence between price and volume to detect hidden reversals.
⚡ 3. Volume Rate of Change (VROC)
VROC measures the speed at which volume changes over a set period. It’s excellent for spotting unusual activity before major price action.
- A spike in VROC often signals something big is about to happen.
✅ Use Case: Anticipate volatility near resistance or support levels.
💹 4. Chaikin Money Flow (CMF)
CMF combines price and volume into an oscillator that indicates buying or selling pressure over time.
- Positive CMF = Bullish sentiment
- Negative CMF = Bearish sentiment
✅ Use Case: Confirm momentum trends or spot divergence before a reversal.
🔗 Combining Indicators for More Precision
No single indicator is perfect on its own. Combining two or more can help filter out false signals and improve your accuracy.
- OBV + A/D Line = Confirms trend with money flow
- CMF + RSI = Momentum + sentiment alignment
- VROC + Candlestick Patterns = Detect explosive moves before they happen
💡 Use TradingView or MetaTrader 5 to combine indicators and experiment with overlays.
A Real-World Example
Let’s say you’re tracking a stock that’s breaking out of a long consolidation zone. You see:
- Volume surging beyond 2x its 20-day average
- OBV making new highs
- CMF staying positive for 5 straight sessions
That’s strong confluence—a high-probability setup supported by multiple volume signals. Entering such trades gives you a statistical edge.
🚀 Building a Reliable Volume-Based Trading Strategy
Once you understand volume’s behavior and the indicators that reveal its meaning, the next step is applying that knowledge in a practical, repeatable strategy. This is where beginners often struggle—not with understanding volume, but with using it consistently in real trades.
Let’s break down how to build a solid volume-based trading strategy from scratch.
Step 1: Define the Setup with Volume Filters
Before anything else, decide what market conditions or volume patterns will qualify a trade for you. For example:
- 🔍 Breakout Trader: Look for consolidation zones followed by a volume spike 1.5x above average.
- 🔁 Reversal Trader: Scan for volume divergence where price hits a new high, but volume is falling.
- 📈 Trend Follower: Enter only if volume confirms trend continuation after a pullback.
A good volume-based setup includes:
- Chart pattern or trigger (like breakout, retest, or support bounce)
- Volume behavior confirmation
- Optional: Confluence from indicators like RSI, MACD, or moving averages
💡 Pro Tip: Use volume as a filter to increase win rate, not as the sole reason to trade.
Step 2: Set Entry, Exit, and Stop Rules
Clear rules reduce emotional mistakes.
Entry Rules (Example):
- Price breaks above resistance + volume exceeds 150% of 20-day average
- OBV or A/D Line confirms uptrend
- CMF above 0.10 to signal strong money flow
Exit Rules:
- Target profit reached (e.g., +8%)
- Volume starts decreasing over 3 sessions
- Bearish candlestick reversal forms on high volume
Stop Loss Strategy:
- Below previous support level
- OR below high-volume cluster that acted as price floor
This approach creates a mechanical system, removing emotions from decisions.
Step 3: Backtest and Refine
You wouldn’t drive a car without brakes, and you shouldn’t run a trading system without testing it.
Use platforms like:
Backtest your volume-based system over different market conditions: bullish, bearish, and sideways. Look for:
- Success rate (aim for 55%+)
- Risk-reward ratio (minimum 1:2 is ideal)
- Drawdowns (limit to what you can emotionally handle)
Refine based on what works best.
Step 4: Add Layers of Confirmation
Volume works even better when layered with:
- Price action (candlesticks, support/resistance)
- Moving averages (50, 100, or 200-day)
- Volatility bands (Bollinger Bands)
This creates multi-dimensional analysis, which reduces false signals.
A Quick Strategy Example: The “Break + Volume Surge” Setup
Trigger: Stock breaks above a key resistance level
Volume Filter: At least 1.8x the 30-day average volume
Indicator Check: OBV is also making a new high
Entry: On candle close above resistance
Stop Loss: Just below resistance
Take Profit: Previous swing high or 2x risk
This type of setup is especially effective during earnings season, biotech catalysts, or macro news events that fuel strong price momentum.
🔒 Risk Management with Volume Data
Smart traders don’t just think about gains—they protect their capital first. Integrating volume data into risk management helps you reduce false entries, avoid emotional traps, and maximize gains with better precision.
Using Volume to Gauge Risk Levels
Volume around key price zones (like support or resistance) often signals how strong that level really is.
- 📍 High volume near support = Strong buying interest. Safer for long entries.
- 🚨 Low volume near resistance = Weak conviction. Breakouts may fail.
- 🔄 Sudden volume drop in trend = Trend may be fading. Time to tighten stops.
💡 Always ask: “Is this move backed by real money?” If not, reduce your position or stay out.
Volume-Based Stop-Loss Strategy
You can use volume to set smarter stop losses, not just based on price.
Method 1: Below Volume Clusters
Place stop loss just below recent high-volume candles or volume profile nodes. These areas represent “fair value” zones where institutions entered. If price breaks below, the trade thesis is likely invalid.
Method 2: Break of Volume Floor
If price starts falling and volume surges in the opposite direction, exit. The surge confirms new sentiment—either heavy selling or reversal strength.
Position Sizing with Volume Confidence
When volume confirms your setup, you might choose to size up slightly (within reason). For example:
- Standard position: when volume is average or just rising
- Max confidence position: when volume explodes 2x average and multiple confirmations are present
⚠️ Never size up on hope. Only with data.
Avoiding Common Risk Traps
Here are common mistakes beginners make—and how volume saves you:
| Mistake | Volume-Based Fix |
|---|---|
| Chasing price on hype | Check if volume supports the move |
| Setting tight stops on low volume | Widen stop slightly or skip the trade |
| Ignoring fake breakouts | Look for confirmation in volume spikes |
Personal Lesson from the Field
Early in my trading career, I entered a breakout trade too eagerly. Price popped above resistance—but volume didn’t move. Within minutes, the price reversed and triggered my stop.
Next time, I waited for volume confirmation. The breakout came again, this time with double the usual volume. I entered, and the stock ran 15% in two days.
Lesson learned: volume is the insurance policy on your entry.
🌐 How Volume Differs Across Markets
Not all markets treat volume the same way. Volume behaves differently in stocks, forex, crypto, and futures, and understanding these nuances is crucial for using volume correctly across asset classes.
Let’s explore how volume works in each of these major markets.
📈 Stock Market Volume
In stocks, volume is transparent and centralized. Exchanges like NASDAQ or NYSE track real trading activity, and you can access exact numbers for:
- Daily volume
- Average volume
- Volume by price (volume profile)
Key Observations:
- Volume spikes often occur during earnings reports, news, or institutional buying.
- Stocks with consistent high volume tend to have better liquidity and lower slippage.
💡 Strategy Tip: Watch for pre-market volume surges—they can be strong signals of momentum that continues into the regular session.
💱 Forex Volume (Tick Volume)
Forex is decentralized, so true volume data doesn’t exist. Instead, brokers provide tick volume—the number of price changes during a time period.
While not “real” volume, tick volume still reflects:
- Market activity
- Volatility
- Interest levels
And it’s surprisingly effective. Studies show a strong correlation between tick volume and actual institutional trading behavior.
💡 Strategy Tip: Look for consistent tick volume rise during London and New York sessions—these time blocks offer the most reliable volume patterns in forex.
💹 Cryptocurrency Volume
In crypto, volume data is fragmented across multiple exchanges like Binance, Coinbase, and Kraken.
Key Differences:
- Exchange-specific: Volume may vary dramatically between platforms.
- Speculation-driven: Many retail traders create high but erratic volume, especially during hype or panic.
- Blockchain data: On-chain volume analysis is becoming more accessible for deeper insight.
💡 Strategy Tip: Use aggregated volume tools like CoinMarketCap or CoinGecko to get a more accurate view of true volume across crypto markets.
📉 Futures and Options Volume
Derivatives like futures and options offer detailed volume insights—including open interest, which shows how many contracts are still active.
What to Watch:
- Volume + Open Interest Rising = Strong new trend forming
- Volume Up + Open Interest Down = Position closing (exit pressure)
- Volume often spikes near contract expiration dates or around economic events (FOMC meetings, NFP reports, etc.)
💡 Strategy Tip: Combine volume with time of day analysis. Futures often see big volume moves during:
- U.S. market open
- Economic news releases
- Pre-rollover periods
✅ Real-World Examples and Practical Lessons
Theory is useful. But nothing beats real-world volume setups that show you how to apply what you’ve learned. Here are some high-impact scenarios that beginners can easily relate to—and learn from.
📊 Example 1: Volume Surge Before Breakout
Setup: A mid-cap tech stock consolidates in a tight range. Suddenly, volume surges 200% above average, but the price hasn’t moved much yet.
Analysis: Smart money may be quietly accumulating ahead of news.
Outcome: The next day, earnings beat expectations, and the stock explodes 18% upward.
✅ Lesson: Volume leads price. If the crowd isn’t watching yet, volume can tip you off early.
💥 Example 2: Volume Divergence Reveals Reversal
Setup: EUR/USD makes a new low during a downtrend, but tick volume falls sharply.
Analysis: Sellers are losing steam, and fewer traders are engaging.
Outcome: A bullish engulfing candle forms, followed by a steady rally.
✅ Lesson: If volume and price don’t agree, pay attention—a reversal may be near.
🚨 Example 3: Fake Breakout on Low Volume
Setup: A popular meme coin breaks resistance on social media hype, but volume remains flat.
Analysis: No real conviction from traders, likely retail-driven.
Outcome: Price crashes 30% within hours.
✅ Lesson: No volume, no trust. Don’t chase breakouts without confirmation.
Common Mistakes to Avoid (With Fixes)
| Mistake | Fix Using Volume |
|---|---|
| Trading on price alone | Add volume indicators to confirm moves |
| Overtrading quiet markets | Use volume filters to stay out of noise |
| Believing all spikes are real | Look for sustained volume, not just one candle |
📈 The Future of Volume Trading in 2025
The world of volume analysis is evolving—and fast. As we move further into 2025, several trends are reshaping how traders use volume.
📊 AI-Powered Volume Tools
Platforms now integrate AI and machine learning to:
- Predict volume spikes
- Identify institutional flow
- Detect “volume fingerprints” of whales
💡 Tools like Bookmap and TrendSpider are leading the way in visualizing real-time volume depth and intent.
🔗 Volume Meets Blockchain Transparency
In crypto, on-chain data is becoming a major edge. You can now:
- Track whale wallet transactions
- View exchange inflow/outflow in real time
- Monitor smart contract volume and DEX activity
This turns volume into a live heartbeat of blockchain behavior—a massive win for short-term traders.
📱 Mobile-Friendly Volume Signals
More platforms are adapting volume analysis to mobile apps:
- Push alerts for volume breakouts
- Volume heatmaps for quick scans
- Voice alerts for reversal signals
Volume trading is no longer limited to complex desktop setups—it’s now accessible to anyone, anywhere.
🧭 Final Thoughts and Beginner Tips
If there’s one takeaway from this guide, it’s this:
📌 Volume doesn’t lie. It tells the truth behind every price move.
Beginner Action Plan:
- Start Simple: Use just one or two volume indicators (OBV + volume profile is a great combo).
- Journal Your Trades: After every trade, log volume behavior and what you missed.
- Trade With Confirmation: Never enter on price alone—always wait for volume to support your setup.
- Use Alerts: Platforms like TradingView let you set alerts on volume spikes—use them!
- Don’t Overcomplicate: Even basic volume bars are powerful when combined with structure.
Final Encouragement 🎯
Volume is often ignored by beginners, but it’s the foundation of professional-level trading. By mastering it early, you give yourself a long-term edge that most retail traders never develop.
Keep practicing, refine your strategy, and most importantly—listen to the volume. It speaks louder than any headline.


