
AI Variance Analysis: Check the Numbers Before the Story
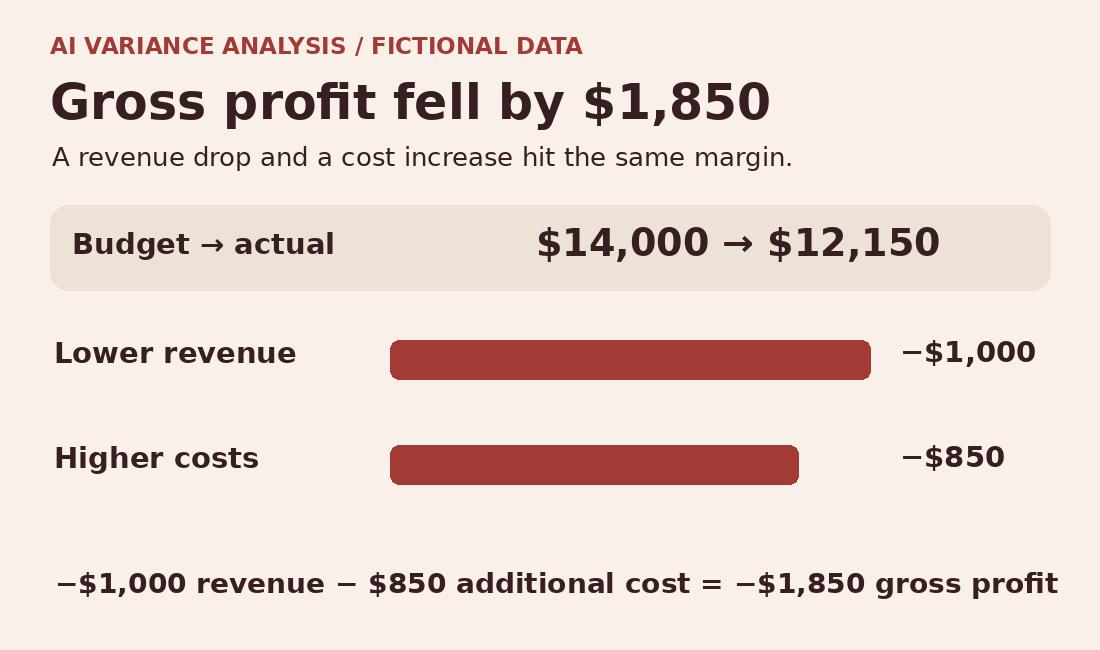
Revenue fell by $1,000, but gross profit fell by $1,850. A quick explanation might blame a discount campaign. The numbers below tell a different and more useful story: the two products moved in opposite directions on selling price, and the two price effects canceled out. The business sold fewer units, shifted toward a higher-priced product, and paid more cost per unit sold. That tells the owner which questions to investigate. It does not tell them which decisions produced those results.
AI variance analysis works best when the spreadsheet owns the arithmetic, independent reports anchor the totals, and a person decides what the evidence supports. Use this worked example to build a repeatable month-end routine without giving an AI tool access to your accounting system. All amounts, products, events and thresholds in the example are fictional. The workflow is for internal analysis, not a substitute for your accounting policies or a recommendation to change prices or spending.
1. Define the comparison before you open the AI tool
A variance is actual minus a named benchmark. Here the benchmark is the original approved monthly budget, not last month, not a revised forecast, and not a sales target copied out of a slide. Each of those comparisons can answer a worthwhile question, but they are not interchangeable. Save the name and date of the budget revision you actually used. If the owner also wants to know how the month performed against the latest forecast, show that as a separate comparison. Do not quietly revise the benchmark just to make the miss look smaller.
Write down the dates, currency, business unit, sales channels, product definitions and whether figures are net of discounts and returns. Decide how the reporting system handles timing, credits and cutoffs. An order export is useful evidence about orders, but it is not automatically a revenue report. An order can have been placed in one period, shipped in another, and credited later. Your approved ledger totals, or a report explicitly reconciled to them, provide the accounting control. The SEC’s beginner guide to financial statements explains the relationship between sales, cost of sales and gross profit; align your internal comparisons with the definitions your business actually uses.
- Lock the source.
Save the approved budget and the closed-period actuals. - Reconcile.
Check units, net revenue and cost against controls. - Explain the arithmetic.
Build bridges with one declared convention. - Test explanations.
Assign an owner and evidence that could contradict them.
Consider a fictional shop with two products. Basic and Plus are sold as individual units, in dollars, across the same reporting scope. In this simplified example, there are no separate freight or overhead adjustments; actual net revenue and cost of goods sold, or COGS, are allocated to the same two product rows. All averages are exact. That last detail is deliberate: spreadsheets should not round a computed average to two decimals and then multiply it back to create a new revenue total.
| Metric | Basic budget | Basic actual | Plus budget | Plus actual |
|---|---|---|---|---|
| Units sold | 600 | 450 | 400 | 450 |
| Net selling price | $20 | $22 | $40 | $38 |
| COGS per unit sold | $10 | $11 | $20 | $22 |
| Net revenue | $12,000 | $9,900 | $16,000 | $17,100 |
| COGS | $6,000 | $4,950 | $8,000 | $9,900 |
2. Build a revenue bridge that separates volume, mix and price
Budget revenue is $28,000; actual revenue is $27,000. Budget units were 1,000; actual units were 900. A bridge starts with one total and changes one assumption at a time until it reaches the other total. The steps are not three movements observed in chronological order. They are three calculations that, together, account for the difference without counting the same dollars twice.
Volume: change the total units and hold the planned split
At 900 total units and the 60% Basic / 40% Plus budget mix, the hypothetical quantities are 540 Basic and 360 Plus. At budget prices, revenue would be 540 × $20 + 360 × $40 = $25,200. Relative to $28,000, that is a −$2,800 volume effect. This is what fewer total units mean when you hold the budget product proportions and budget prices fixed. It does not assume that the lost units had a real-world 60/40 split. That split is a measuring convention.
Mix: change the split and keep prices at budget
Replace the 540/360 hypothetical counts with the actual 450/450 counts. Use the same $20 and $40 budget prices. Revenue under those assumptions rises to $27,000. The change from $25,200 is a +$1,800 mix effect. Basic is 90 units below its mix-adjusted comparison, worth −$1,800 at budget price. Plus is 90 units above its mix-adjusted comparison, worth +$3,600. Notice the wording: Plus outsold its original 400-unit budget by 50, but it outsold its 360-unit volume-adjusted comparison by 90. Those numbers have different denominators and belong in different sentences.
Price: change the prices at the actual quantities
Basic actually earned $22 instead of $20, so its price effect is 450 × $2 = +$900. Plus earned $38 instead of $40, so its effect is 450 × −$2 = −$900. The net price effect is $0, even though neither product’s price was unchanged. Check the whole bridge: −$2,800 + $1,800 + $0 = −$1,000. Actual revenue is down 3.57% versus budget, using $28,000 as the denominator.
Budget
Volume
Mix
Net price
Actual
Check the blended average as a teaching exercise, not as a substitute for the bridge. Budget revenue per unit was $28. Actual revenue per unit was $30. Reporting “price rose by $2” would be misleading: the business sold a larger share of Plus, where the budget price is higher, while the net product-level price effect was zero. On the other hand, saying “prices held steady” would hide the $900 gain and the $900 loss. Keep the two rows visible even when the total effect cancels. They may require entirely different checks.
Another analyst may use a different order and assign some interaction between price and quantity differently. The total variance must still agree with the same sources. Publish the convention you use, apply it consistently and flag changes in a comparison across months. Do not compare price effects from two models as though they were the same measure merely because both are called “price.”
3. Bridge COGS before interpreting gross profit
For this example, report COGS as a positive expense. A COGS increase is therefore positive in the cost bridge but negative in the gross-profit bridge. Budget COGS is $14,000 and actual COGS is $14,850. At the 540/360 volume-adjusted quantities and budget costs, COGS would be 540 × $10 + 360 × $20 = $12,600, a −$1,400 volume effect. At the actual 450/450 mix and budget costs, COGS would be $13,500, a +$900 mix effect. At actual costs the result is $14,850, a +$1,350 unit-cost effect made up of $450 Basic and $900 Plus. The net COGS change is −$1,400 + $900 + $1,350 = +$850.
Gross profit fell from $14,000 to $12,150. Subtract the $850 COGS increase from the $1,000 revenue decline and you get −$1,850. The budget gross margin rate was 50%; actual was 45%. That is five percentage points lower, not a five-percent decline. If the owner asks which figures matter, lead with the dollar gap and use the rate as a second view. A falling rate and a falling dollar profit are related here but they do not always move together.
−$2,800 revenue less −$1,400 COGS
+$1,800 revenue less +$900 COGS
Opposite price effects cancel
Higher COGS at actual quantities
“Unit cost” is an arithmetic label, not a finding that supplier prices rose. Average COGS can reflect the mix of lots or batches sold, different sourcing, allocated costs, inventory adjustments, or a change in cost classification. You cannot tell which from these two rows. Ask which component changed, when it entered the cost of the goods sold, and whether the treatment matches the budget. If a material expense has no product allocation, add a separate unallocated line that ties to the ledger rather than forcing it across items. In this teaching example that line is zero.
Check the two product rows before choosing the first question
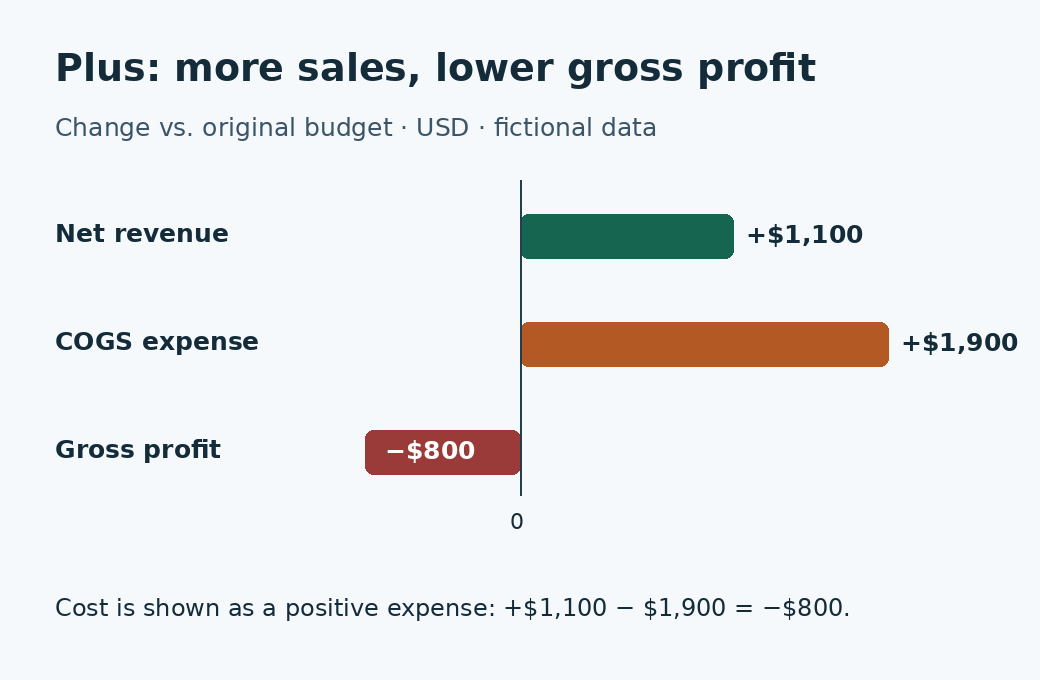
Basic’s gross profit fell from $6,000 to $4,950, a $1,050 decline. Plus fell from $8,000 to $7,200, an $800 decline, despite selling 50 more units than originally planned. Looking only at total units could make Basic feel like the whole problem. Looking only at the mix effect could make Plus look like an unqualified success. Neither reading survives the product-level gross-profit check. Start by asking two narrower questions: why did Basic sell fewer units, and why did the additional Plus units not translate into higher gross profit?
Plus also shows why a revenue win deserves a cost check. Its revenue grew by $1,100 while its COGS grew by $1,900. At budget unit economics, 50 additional units would have contributed $1,000 of gross profit. At the actual quantity, however, the lower average selling price took away $900 and the higher average unit cost took away another $900. Thus $1,000 less $1,800 equals the $800 decline. This is a product-level check against its original budget, not a second set of effects to add to the overall bridge. It uses no shared product-mix allocation, so it answers a different question.
If you only have time for one investigation, choose the one whose evidence can realistically change the next decision. For instance, a ledger trace might quickly distinguish an isolated inventory adjustment from a recurring cost increase. Put that check ahead of a broad discussion about redesigning a promotion. If the trace cannot settle the question, document the missing record and move on to the next check. The objective is to reduce uncertainty, not to get a tidy explanation for every line before the meeting ends.
4. Set tolerances that keep mistakes visible
Build two different checks. A source check compares the worksheet’s control totals to independent reports. A bridge check subtracts the modeled effects from the actual-minus-budget total. Both must pass. A bridge can be perfectly balanced and still be wrong if the actual revenue export omits an entire sales channel: every formula can faithfully reconcile the wrong input. Conversely, correct inputs cannot save a bridge with a formula copied one row too far.
For this example, require exact integer-unit ties, exact ties to the reported cent for the approved revenue and COGS controls, and tolerance of at most $0.01 for a computed bridge residual due only to floating-point representation. These are illustrative gates, not industry standards. Keep full precision in the working model and round only the display. If displayed steps sum one cent away from the displayed total, disclose that as display rounding. Do not call a source discrepancy “rounding” until you can identify it. A threshold for which genuine variances merit investigation is a different choice: small offsetting product changes may still matter even if the total is below that threshold.
Record the budget and actual revenue and COGS controls separately; do not check only the difference. If both sides are short by $500, the net variance could still look right. If revenue ties but units do not, you cannot trust net price per unit. If revenue and units tie but COGS does not, release the revenue bridge only if it is clearly marked separate and your review process allows it; do not publish the gross-profit story as checked. Mark the reason for each blocked section and the reviewer responsible.
Handle edge cases as exceptions, not as invisible zeros. A new product has no agreed budget price or planned unit cost. A discontinued product may produce a credit when there are no net units. Services measured in hours and boxes measured in cases may not belong in one unit-based mix. Name the problem and use a separate, labeled scope or adjustment line with an independent control. If you cannot explain how it reconciles, say the bridge is incomplete. Replacing a division error with zero makes a worksheet prettier, not more accurate.
5. Copy this worksheet and test it on two rows
Use one row per comparable product, and put the independent controls on a separate sheet or clearly separate block. For this example, the spreadsheet has headers in row 1, Basic in row 2 and Plus in row 3. Columns D and E are net-revenue totals, not prices; F and G are COGS totals, not rates. The calculations below assume nonzero budget and actual units for both rows. Use a separate exception line if that is not true. For a longer list, extend the anchored ranges deliberately and compare them with the number of rows in the source export.
A Product              B Budget units    C Actual units
D Budget net revenue   E Actual net revenue
F Budget COGS          G Actual COGS
H Budget price         =D2/B2
I Actual price         =E2/C2
J Budget unit cost     =F2/B2
K Actual unit cost     =G2/C2
L Units at budget mix  =SUM($C$2:$C$3)*B2/SUM($B$2:$B$3)
M Revenue volume       =(L2-B2)*H2
N Revenue mix          =(C2-L2)*H2
O Revenue price        =(I2-H2)*C2
P COGS volume          =(L2-B2)*J2
Q COGS mix             =(C2-L2)*J2
R COGS unit cost       =(K2-J2)*C2
S Gross profit change  =(E2-G2)-(D2-F2)
T GP bridge residual   =S2-(SUM(M2:O2)-SUM(P2:R2))
Copy the displayed row-2 formulas down once. Verify the adjusted units in L sum to 900. Check that E sums to $27,000, G to $14,850, D to $28,000 and F to $14,000. Then compare those figures to the independent controls you wrote down before calculating the bridge. The example’s revenue residual is SUM(E2:E3)-SUM(D2:D3)-SUM(M2:O3); its COGS residual is SUM(G2:G3)-SUM(F2:F3)-SUM(P2:R3). Check row-level and total residuals, not just the total. Offset can conceal two bad rows just as it can conceal two price movements.
Before trusting a copy of the workbook, run two deliberately simple checks. First, copy budget inputs into the actual columns in a test copy. Every effect should become zero. Next, hold prices and costs at budget and multiply both unit quantities by the same proportion. Only the volume columns should move. If mix or price appears, inspect the inputs and anchored ranges. Restore the fictional sample afterward and verify the expected signed effects. Save the tested workbook version so next month does not start with formulas copied out of a message thread.
6. Use AI to propose a check, not certify a cause
Start with synthetic data. For an authorized real run, use only the minimum business data permitted for the selected tool and purpose. An aggregated row can still give away confidential pricing or sales performance. Do not paste raw invoices, customer names, bank details, payroll, supplier contracts or access tokens into a prompt. Check the approved handling rules before sharing even a cleaned table. The NIST generative AI risk profile describes how models can generate false information confidently. A reconciled table prevents some mistakes in the input; it does not make the model’s interpretation reliable by itself.
Use only the approved, aggregated table and reconciliation status below.
First say which totals and residuals were checked. If any required
control failed, stop and identify that check. Do not repair the numbers.
Separate: (1) verified observations, (2) hypotheses clearly labeled,
and (3) the specific evidence needed to test each hypothesis.
For each observation cite the row, metric and period in the supplied data.
For each hypothesis give one check that could weaken it, plus an owner role.
Do not invent campaigns, stockouts, invoices, causes or missing inputs.
Mention product-level offsets and the bridge convention. Use dollars and
percentage points correctly. End with up to three next checks, not decisions.
Here is how the distinction plays out. “Basic sold 150 fewer units than its original budget” is an observation. “Basic was unavailable when customers wanted it” is a hypothesis. The next check is a dated comparison of available inventory, order cancellations and unfulfilled demand for the same SKU and channel. If the item stayed available on the relevant days, that weakens the stockout hypothesis. It still does not prove that marketing or the benchmark was to blame. The hypothesis deserves a check, not a headline.
For the cost change, check the cost layers or product-level accounting records used for the actual sold units, with the person who owns that data. Look for evidence that can distinguish a changed purchasing cost from a changed valuation or allocation. Where evidence covers only two of four weeks, write that down. If a proposed explanation depends on a specific shift in buyer behavior or promotion exposure, the monthly totals alone are not enough. Even when two changes happened together, deciding what caused what may require a credible comparator, a better time series or a controlled test.
- Observed
- Basic actual units were 450 versus 600 budget.
- Possible, not established
- Unavailable stock reduced sales.
- Check that could disagree
- Compare in-stock records and cancellations on the same dates. Continuous availability weakens the explanation.
7. Run a small Month 1 pilot
Week 1: choose the narrowest useful close. Pick one product family, one closed month and one approved budget. Name a preparer, a reviewer and someone who can check operational records. Agree on the controls and exception rules before opening the data. Write which questions this report cannot answer, such as campaign effectiveness, if the inputs do not contain evidence about it.
Week 2: test the model without private inputs. Rebuild the fictional sample and try the zero-change and same-mix tests. Separately introduce a fake missing row to verify that the control check stops the workflow. Save the results and fix the sheet before discussing what AI tool to use. A model that cannot catch a planted mismatch in two products is not ready for two hundred.
Week 3: do one reviewed comparison. If the permissions, scope and source checks are in order, prepare one approved comparison and review any AI-generated interpretation against the figures. Keep track of suggestions discarded for lack of evidence. Time the preparation and review together; a polished summary that takes longer to fact-check than to write is a poor trade.
Week 4: keep, revise or stop. Keep the routine if a second person can reproduce the totals, the bridge resolves the business question, and the team takes at least one evidence-gathering action that the old report missed. Revise it if the data can tie but review time remains high. Stop expanding the workflow if the inputs still do not reconcile or the tool encourages unsupported causal claims. The first deliverable is a trustworthy one-page review, not a new software subscription.
Write the one-page close note as a decision record
Put three lines at the top: benchmark name, actual period, and the date the controls were signed off. Then show budget and actual units, net revenue, positive COGS, gross profit dollars and gross margin rates. Keep the report uncluttered by listing the arithmetic effects in the order used in the worksheet. Place any unreconciled scope items right under the totals, where readers will find them before the explanation. Do not bury an unresolved adjustment in a footnote more likely to be ignored than acted on.
After the arithmetic, add a column for evidence status. Use three words the team can apply consistently: measured for facts matched to the worksheet, supported for an explanation corroborated by another record, and unverified for something that still needs a check. Define supported narrowly: evidence of a supplier invoice price change might support a cost explanation, but only if the affected inventory is among the units recognized as sold in this period. If the timing is unresolved, leave the story unverified rather than moving it up a category because it sounds plausible.
Record a next action as a question that an owner can close. “Operations to compare shipment timing and cancellations for Basic for the closed month” has an investigation scope. “Operations to improve performance” does not. Put an expected delivery date and an evidence location beside the action, and note any limit on who may see the underlying file. Keep the original evidence wherever the business normally stores it; the AI tool does not need it just to format the note.
Finally, log changes after the close. If a corrected source report changes an actual total, preserve the first version, record the new source and rerun the control and bridge together. If only a hypothesis changes, update the investigation note without changing the arithmetic. That separation is valuable in the next meeting: people can disagree about why something happened without arguing over which report was used. It also makes a sensible Month 2 test possible. Ask whether the same two people can reproduce the work from the retained sources and explain any changes in convention without relying on chat history. If they cannot, fix the documentation or model before broadening the scope. Consistency is a useful outcome even in a month with no large surprises.
At the next review, try this sentence: “Gross profit was $1,850 below budget; the bridge reconciles; we will verify which cost components changed before assigning a cause.” That is short enough to read in a meeting and precise enough for a reviewer to challenge. If you can say it and show the worksheet behind it, the AI has done its job without taking over the judgment.